Value shares, are shares that trade at a lower price relative to fundamentals such as dividends, earnings etc. Growth shares are shares that have the potential to grow above the average market growth. Generally, growth shares do not pay dividends.
It’s important to note that the portfolios we recommend are tilted to the drivers of return; value versus growth, profitability and smaller size. The portfolios are tilted to value shares, but do not exclude exposure to growth shares. It’s just that the percentage exposure may be below the market level. This is because we want to have diversification and not exclude sectors of the economy.
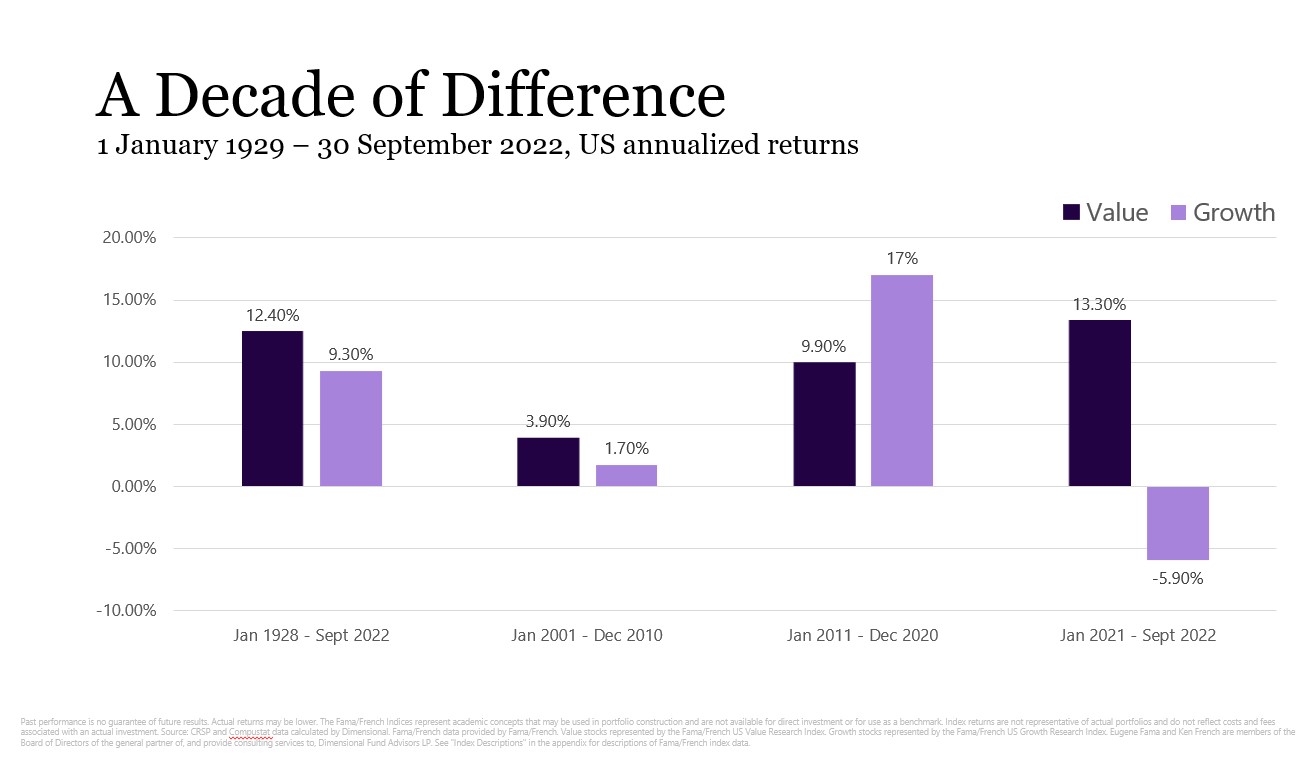
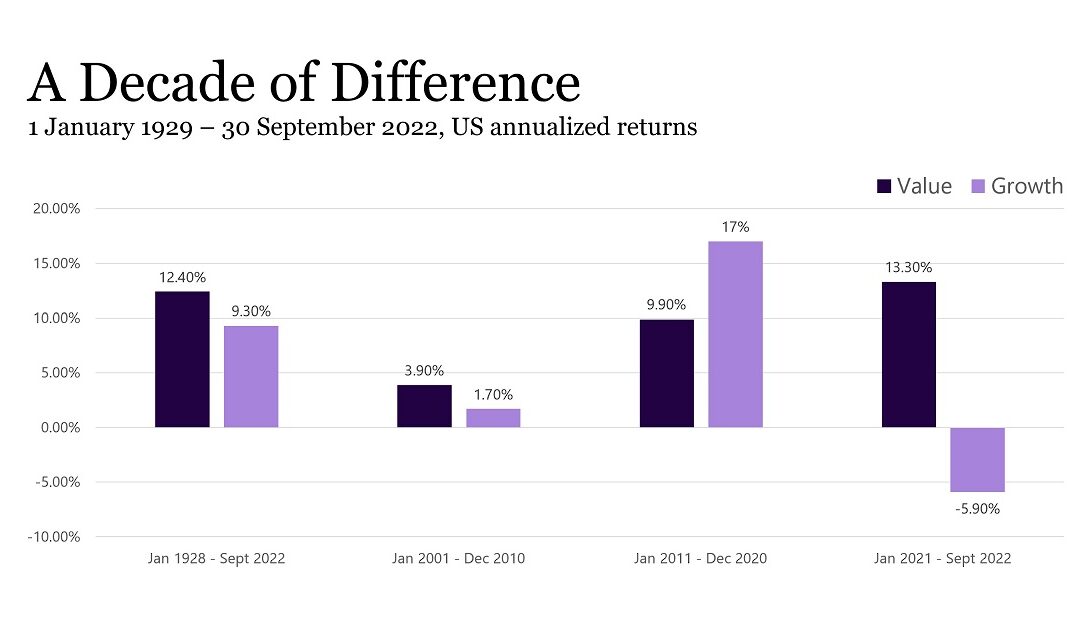
In the long-term, investing in value shares outperforms growth shares. This is certainly evidenced in this bar chart for the 95 years between 1928 and 2022, and again in the decade 2001 to 2010.
With the strong returns in the growth stocks (such as Netflix, Facebook, Apple, Amazon) in the decade 2011 to 2020 there was talk of a new paradigm shift where growth shares would continue to outperform value shares.
In the last two years we have seen a very strong reversal in returns between value and growth shares, with value strongly outperforming.
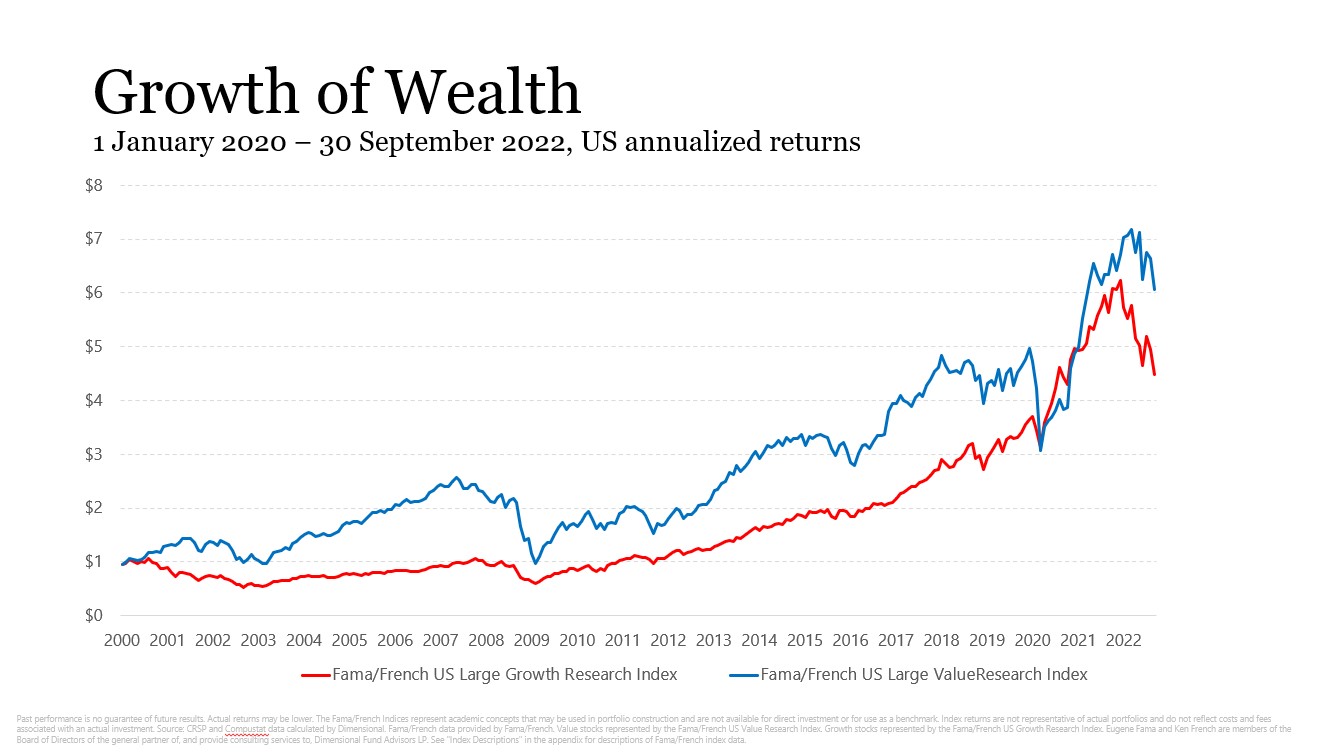
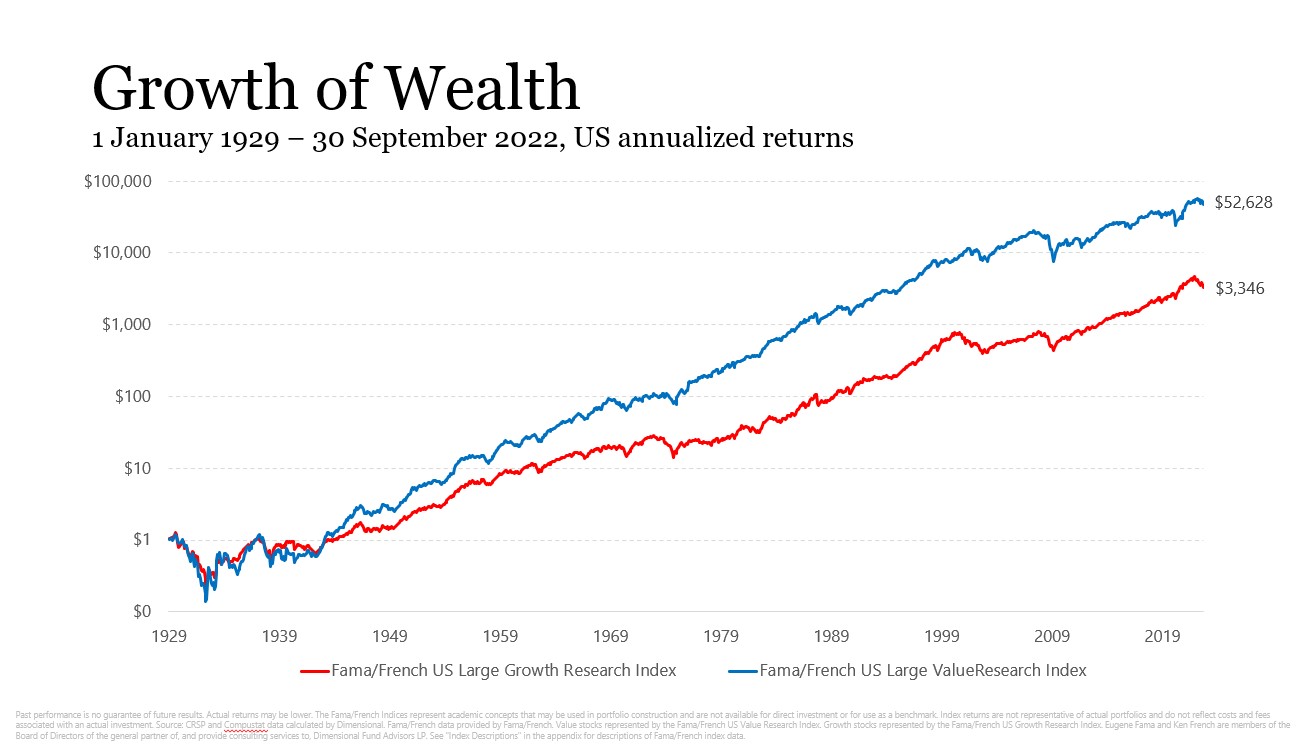
It is even more noticeable when we look back at the last 95 years.
This is a log graph and shows if $1 was invested in 1929 in value shares it would have grown to $52,628, but if the same $1 was invested in growth shares it would only be worth $3,346.
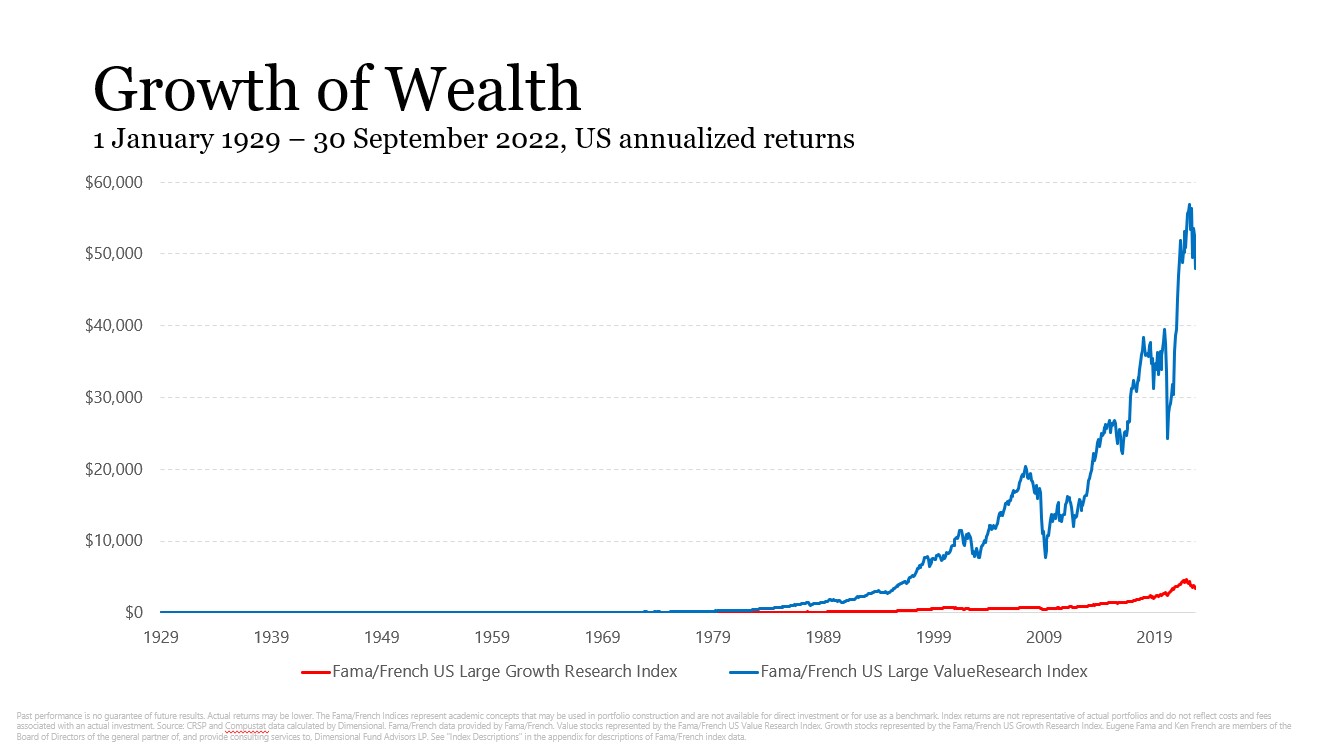
This difference in returns between value and growth shares looks more decisive when graphed on a linear scale.
This is what it means to outperform by on average 3.1%pa for 95 years.
Past performance is no guarantee of future results. Actual returns may be lower.
The Fama/French Indices represent academic concepts that may be used in portfolio construction and are not available for direct investment or for use as a benchmark. Index returns are not representative of actual portfolios and do not reflect costs and fees associated with an actual investment.
Source: CRSP and Compustat data calculated by Dimensional. Fama/French data provided by Fama/French. Value stocks represented by the Fama/French US Value Research Index. Growth stocks represented by the Fama/French US Growth Research Index. Eugene Fama and Ken French are members of the Board of Directors of the general partner of, and provide consulting services to, Dimensional Fund Advisors LP.

