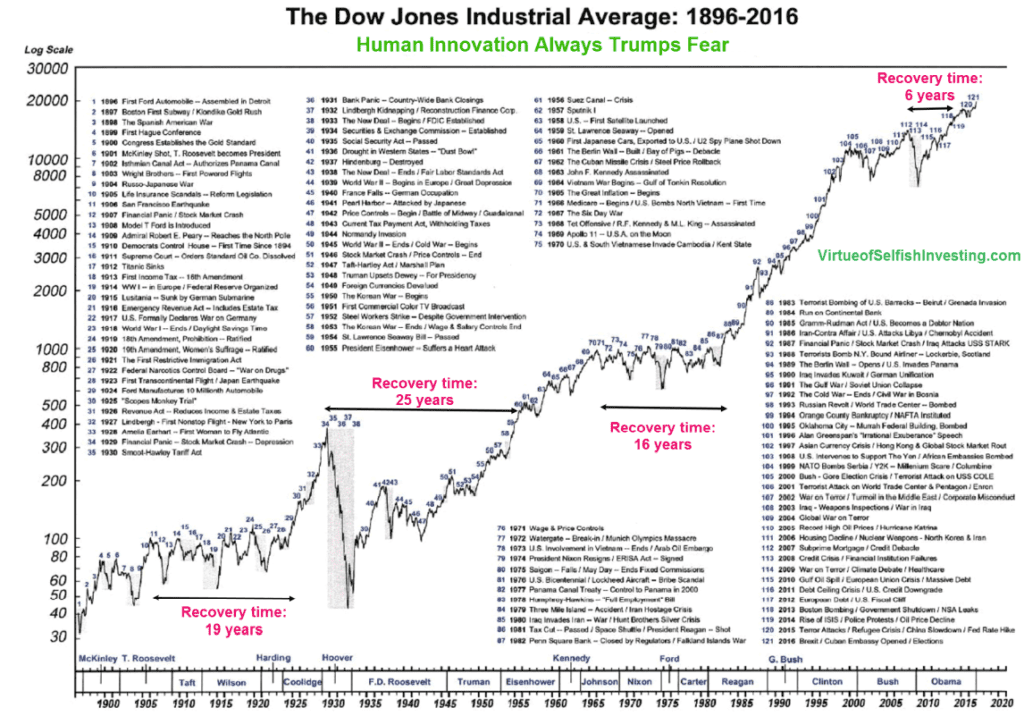
The chart shows the index’s peaks and troughs have reflected the U.S. economy’s triumphs and tribulations over this 120 year period. This chart also illustrates how the Dow Jones Index has become a chronicle of investors’ responses to significant global events.

Originally there were 12 stocks in the Index, today there are 30 .
The key takeaway from this chart is that the stock market has always risen over a long period of time. According to Kacher, the chart shows how “intelligence, creativity, and innovation always trump fear.”
Over the long term the Index has continued to rise and has always recovered from its recessions and depressions.
At the end of 2021 the Dow Jones Industrial average was just over 36,400.

